CMS Market Share 2026

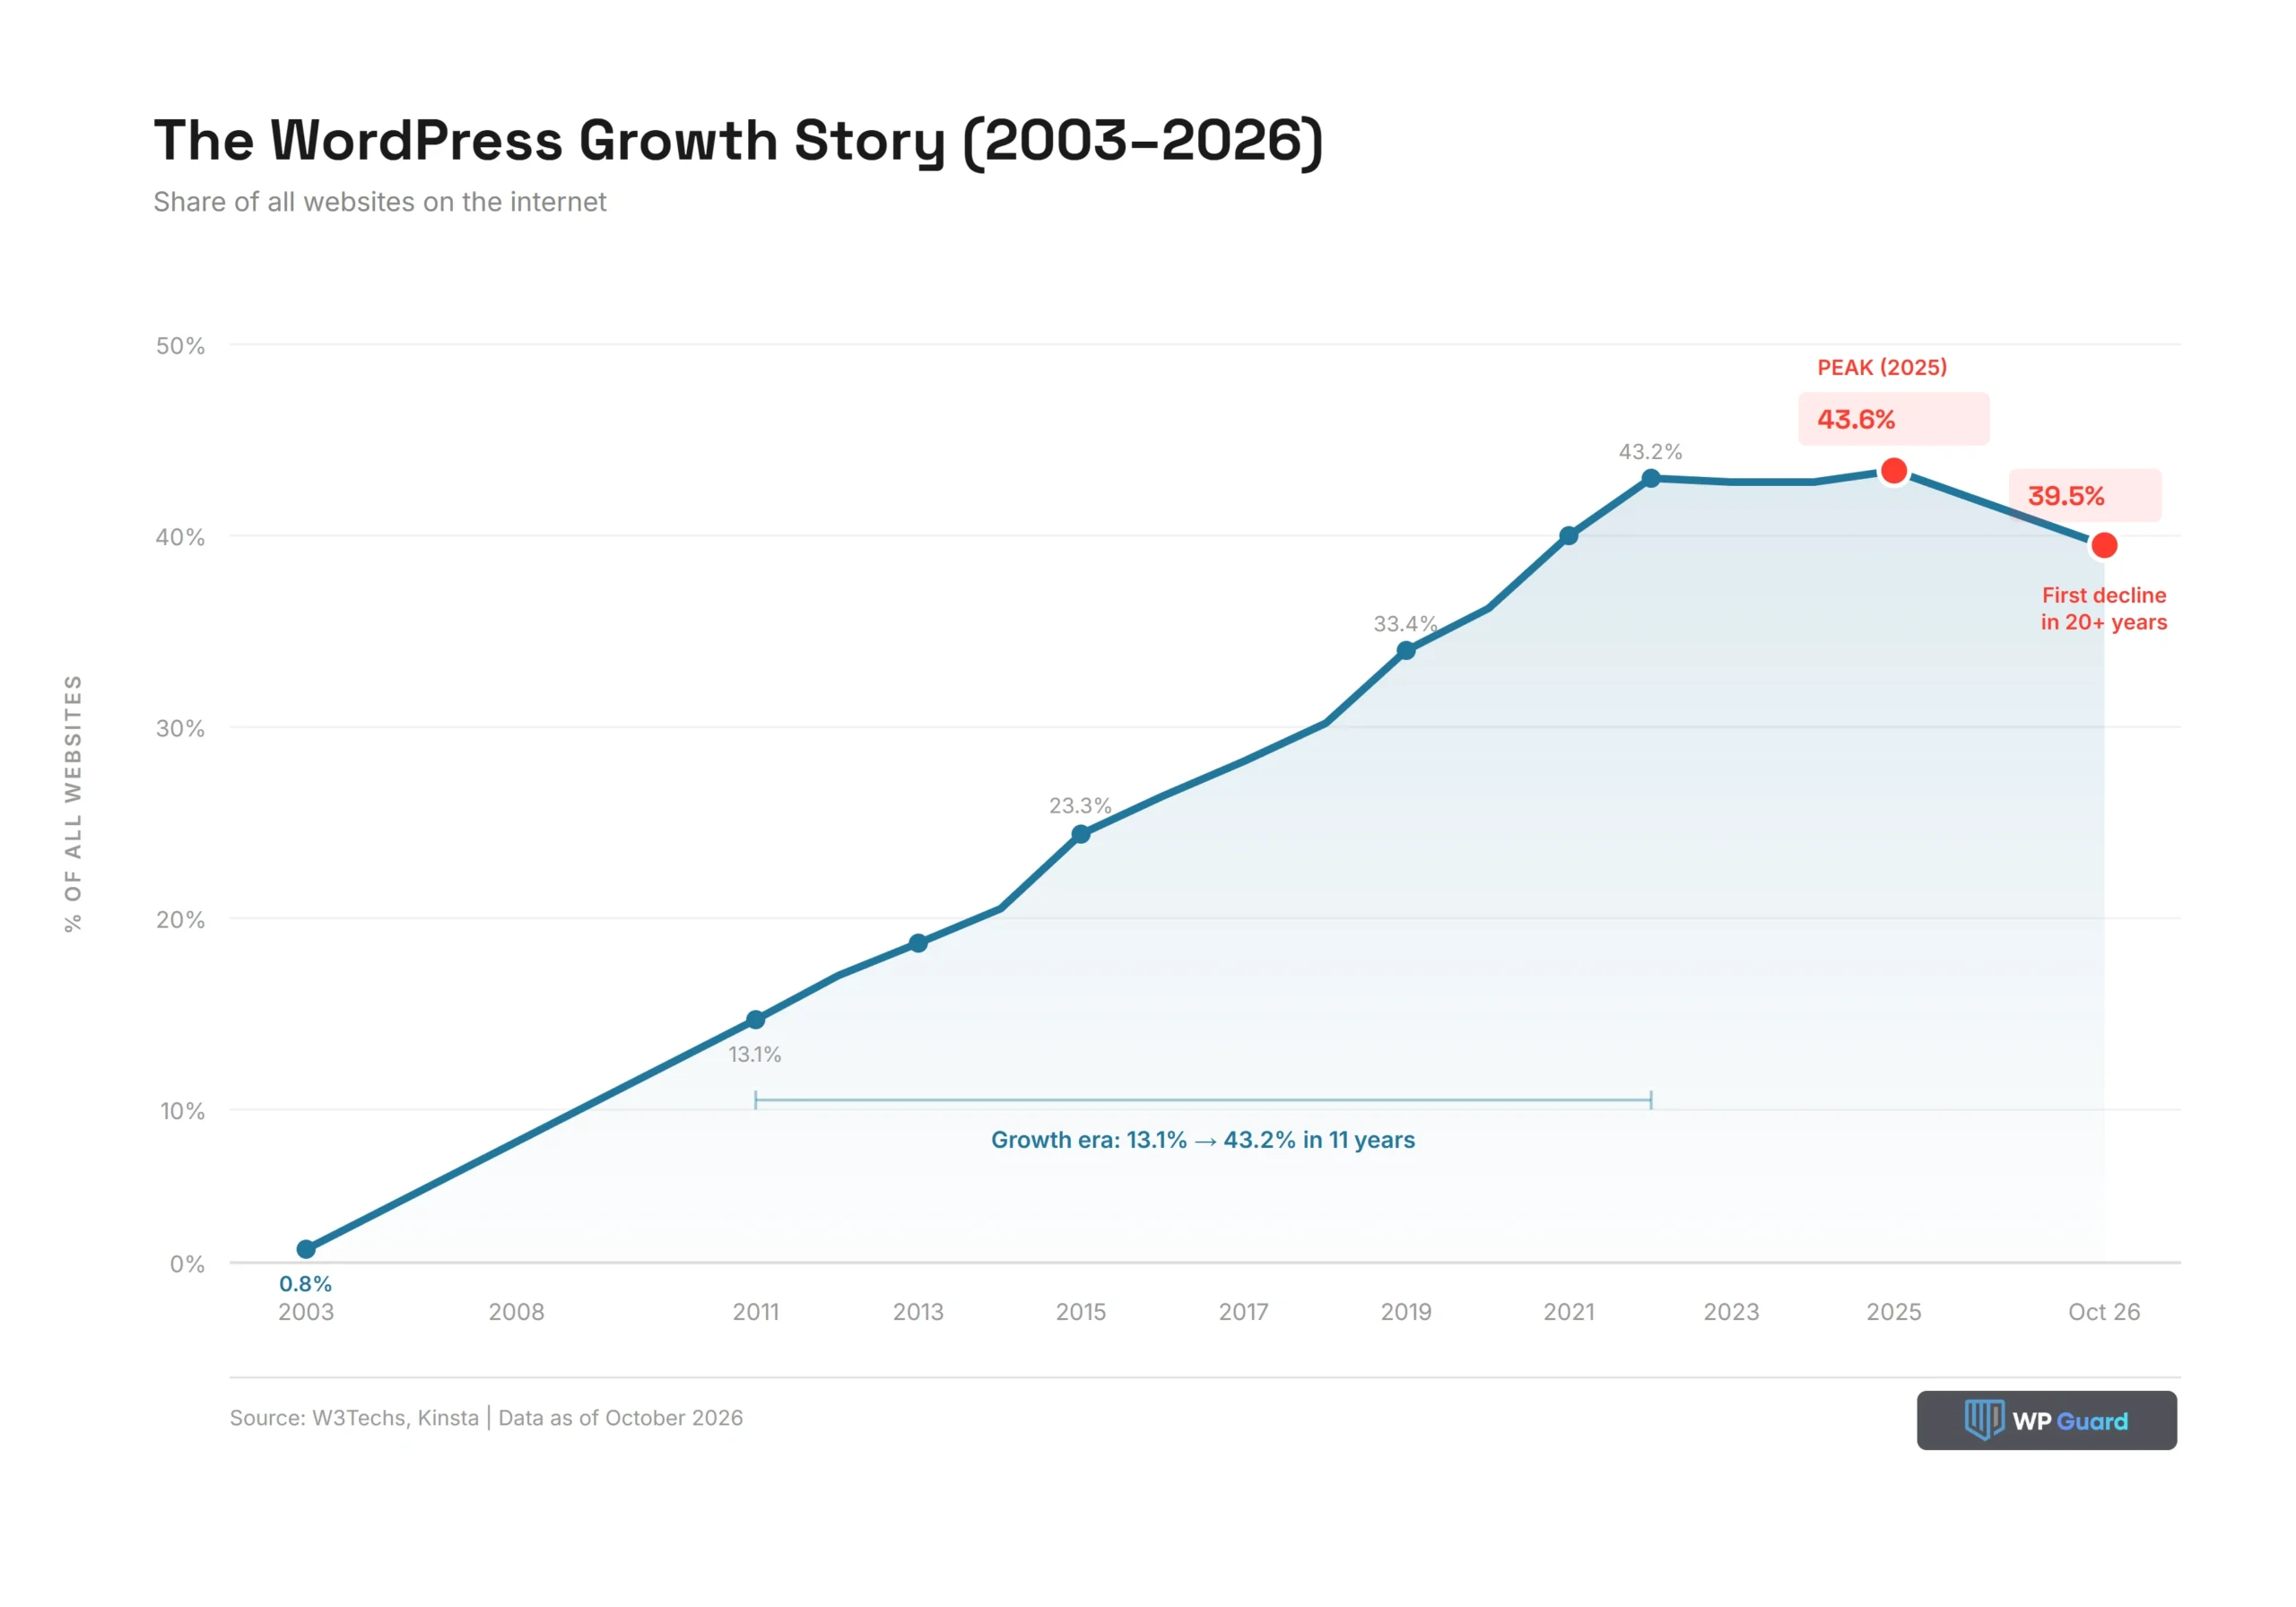
WordPress just dropped below 40% of all websites (measured by domains with websites). This is the first time in its history that there has been a major decline. After more than two decades of uninterrupted growth, the platform is losing ground to SaaS competitors.
A content management system (CMS) is the software behind your website. It handles page creation, blog publishing, product listings, and design all in one place. Currently, WordPress, Shopify, Wix, and Squarespace are dominating the market, but the gap between them is narrowing steadily.
So where does each platform actually stand? We break down the numbers below, along with historical trends going back to 2015, security data, revenue figures, and performance benchmarks.
CMS Market Share: Key Takeaways
- WordPress dropped to ~39.5% of all websites, its first decline in over 20 years (W3Techs, 2026).
- Shopify, Wix, and WordPress together control ~73% of the CMS market (Hashmeta, 2025).
- Wix grew 32.6% year-over-year, the fastest growth of any major CMS (SEJ, 2025).
- 67.9% of all websites now run on a CMS (W3Techs, 2026).
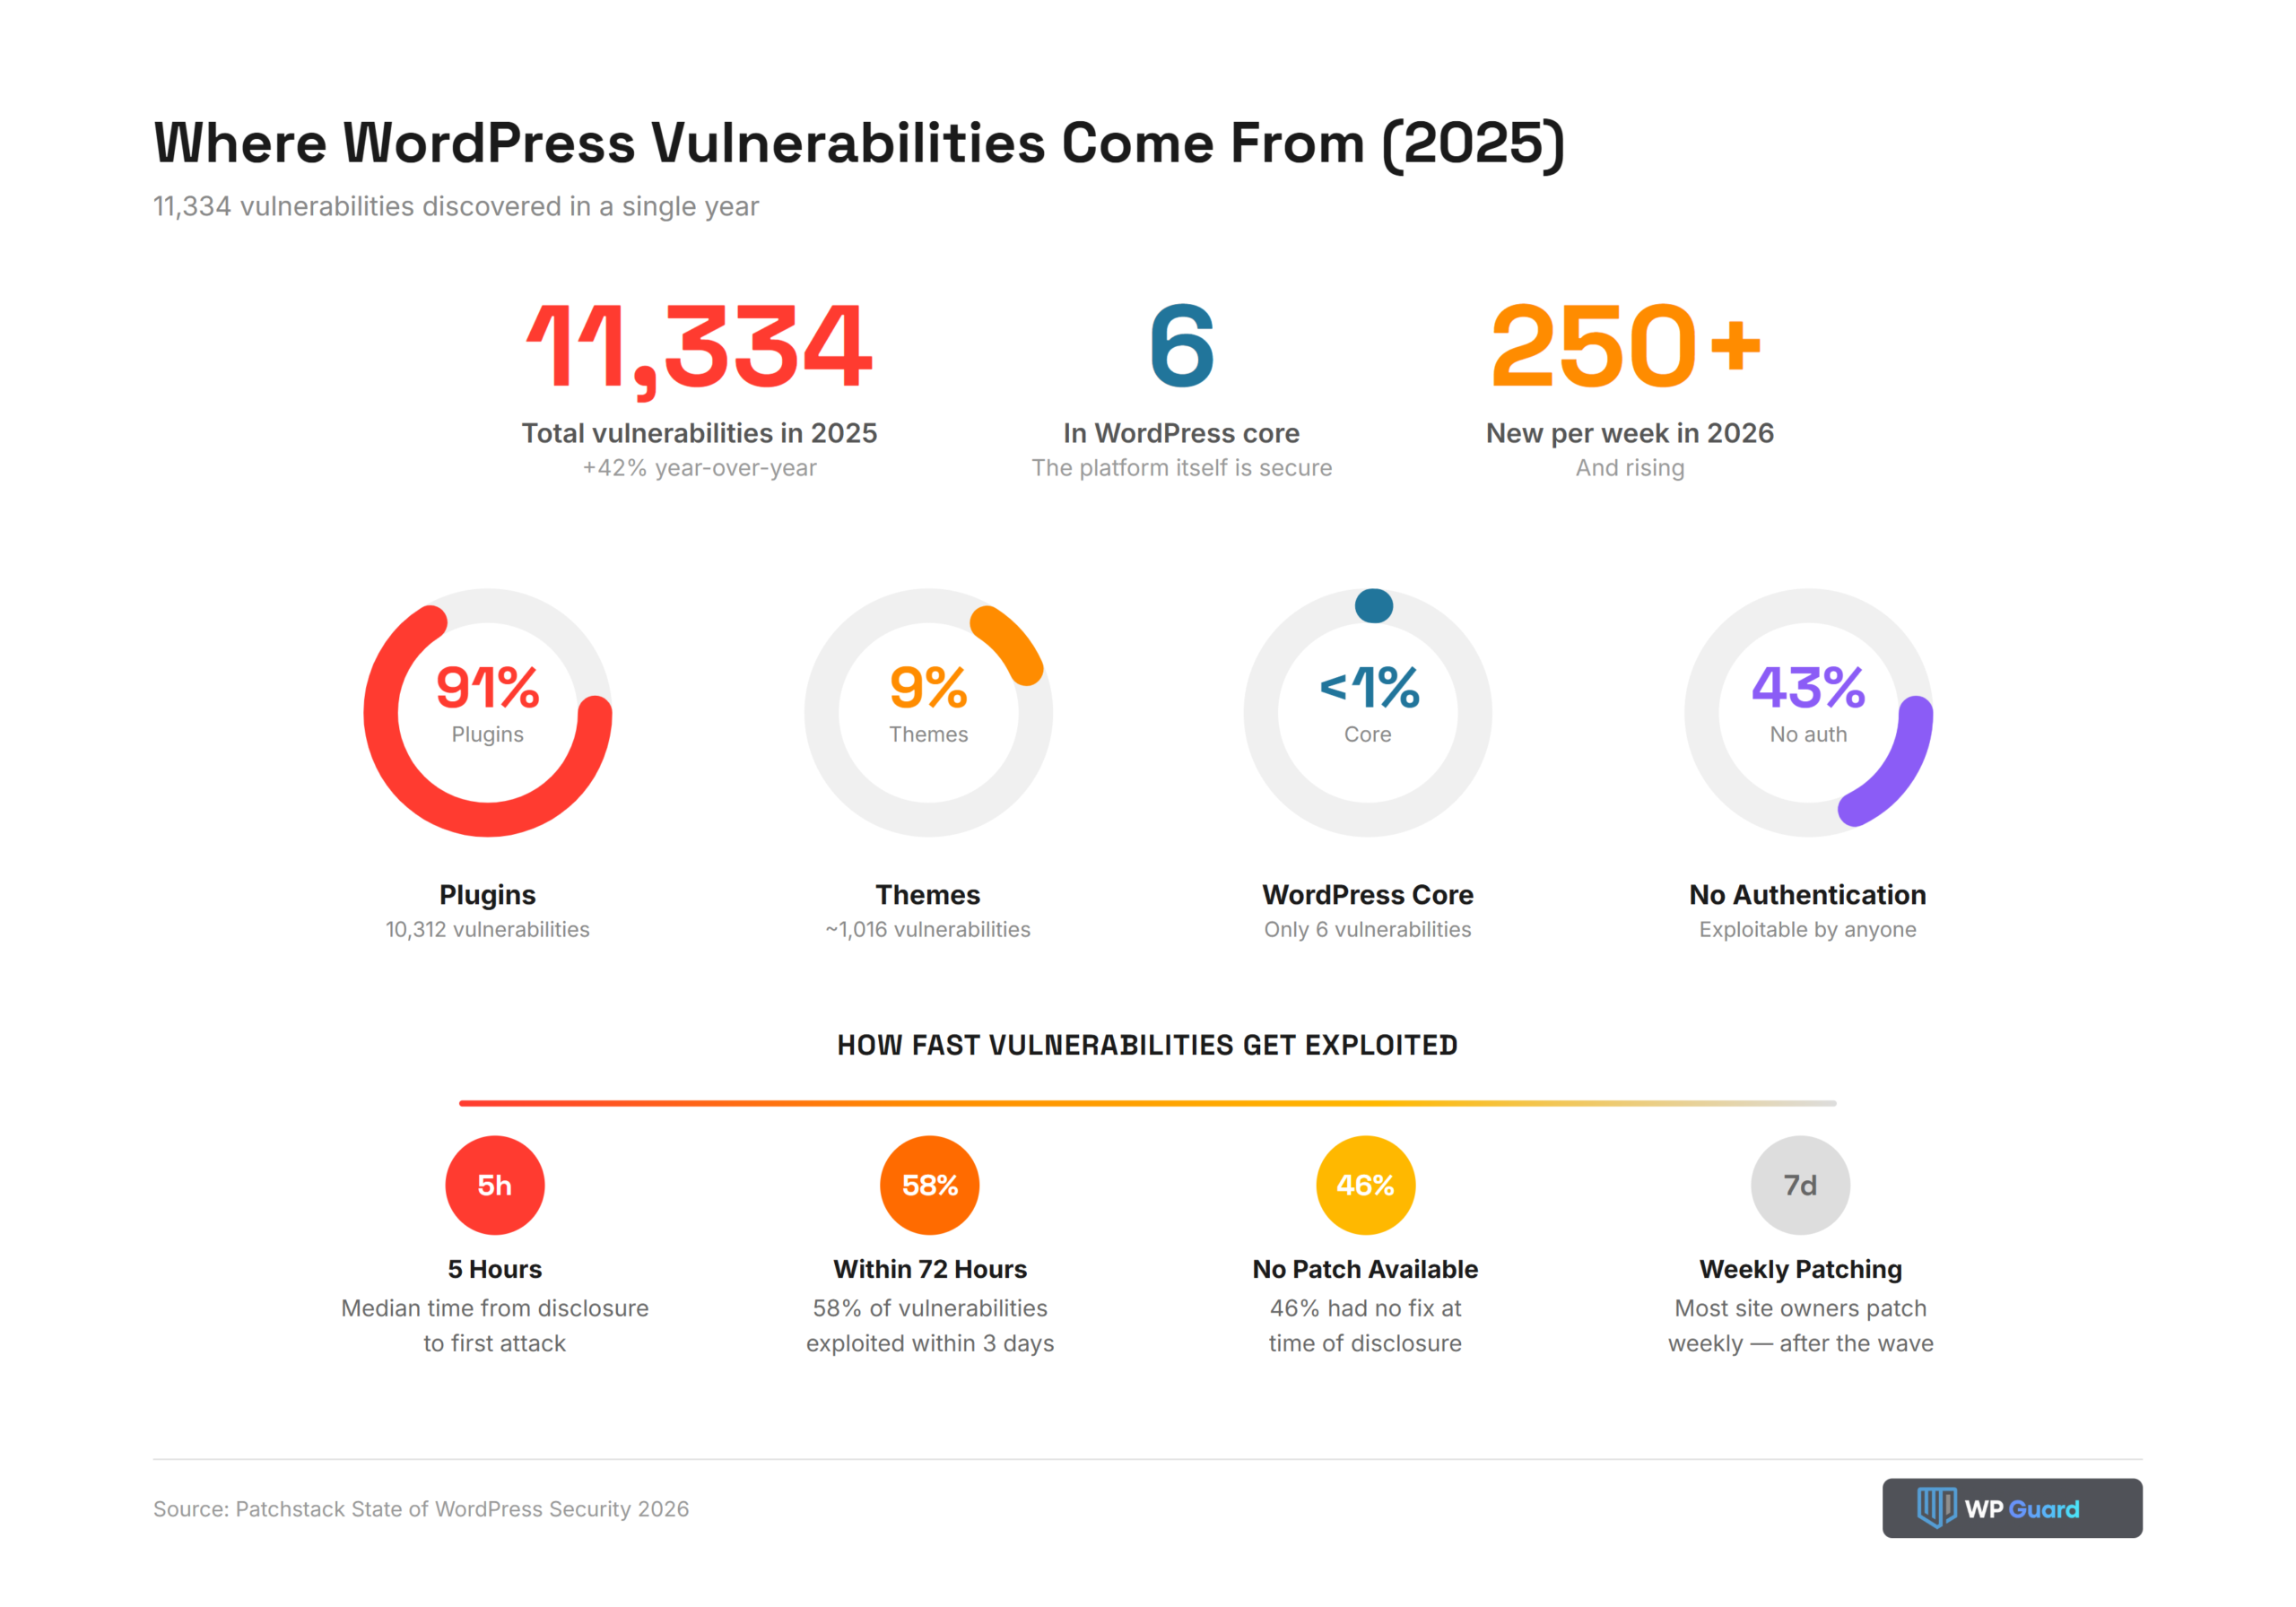
- 11,334 WordPress vulnerabilities were discovered in 2025, 91% from plugins (Patchstack, 2026).
- The global CMS software market is valued at $38.5 billion in 2026 (Grand View Research, 2026).
Content Management Systems in 2026: The Basics
CMS platforms generally fall into two categories:
Open-source options like WordPress, Joomla, and Drupal give you full control over your site, but you manage hosting, updates, and security yourself. On the other hand, SaaS platforms like Shopify, Wix, and Squarespace handle all of that for you, though you lose control over things like custom code and server configuration.
Right now, the open-source CMS market share is shrinking while SaaS platforms are gaining it. For instance, the global CMS software market sits at $38.5 billion in 2026 and is projected to hit $77.77 billion by 2033 (Grand View Research, 2026).
With that context in mind, let’s look at how the numbers actually break down.
CMS Market Share Overview
The table below tracks every major platform’s share of all websites from 2015 to Oct 2026.
| CMS | 2015 | 2018 | 2020 | 2022 | 2024 | 2025 | Oct 2026 |
| WordPress | 23.3% | 29.2% | 35.4% | 43.2% | 43.1% | 43.6% | ~39.5% |
| Shopify | 0.3% | 0.9% | 1.9% | 4.4% | 4.1% | 4.7% | ~5.3% |
| Wix | 0.1% | 0.4% | 1.3% | 1.9% | 2.6% | 3.3% | ~4.2% |
| Squarespace | 0.2% | 0.7% | 1.5% | 1.8% | 2.1% | 2.2% | ~2.4% |
| Joomla | 3.3% | 3.2% | 2.6% | 1.7% | 1.7% | 1.6% | ~1.1% |
| Drupal | 2.0% | 2.3% | 1.7% | 1.3% | 1.1% | 0.9% | ~0.6% |
| No CMS | 61.7% | 51.3% | 43.1% | 33.8% | 31.4% | 29.6% | ~32.1% |
Sources: W3Techs Historical Trends, Colorlib (2026), CMSConf (2025)
A few things stand out from this data:
- WordPress, Shopify, and Wix together control roughly 73% of the entire CMS market (SEJ, 2025).
- Around 71% of all websites now run on a CMS. Only 29% operate without one (W3Techs, 2026).
- WordPress still holds ~59.1% share among sites with a known CMS, but that figure peaked at 65.2% in 2022 (Colorlib, 2026).
- Wix grew by 32.6% in a single year, making it the fastest-growing major CMS on the market (SEJ, 2025).
- Every SaaS platform in the top ten grew year over year. And every open-source CMS except WordPress declined.
CMS Market Share Trends (2015–2026)
Between 2015 and 2022, WordPress nearly doubled its CMS market share, going from 23.3% to 43.2%. That growth has since reversed, and SaaS builders are the ones picking up new sites.
- WordPress: peaked at 43.5% (mid-2025), dropped to 39.6% (Oct 2026). First recorded decline in 20 years (WPPoland, 2026).
- Shopify: 0.3% → 5.1% since 2015, roughly 1,600% growth (W3Techs, 2026).
- Wix: 0.1% → 4.3% since 2015, a 43x increase (Colorlib, 2026).
- Joomla: 3.3% → 1.3%, a 61% decline.
- Drupal: 2.3% (2018 peak) → 0.7%, a 70% decline.
- No CMS: 61.7% (2015) → ~29% (2026).
Basically, open-source platforms outside WordPress are shrinking every year while SaaS builders keep growing. And WordPress itself is no longer expanding, which raises a question: what do the WordPress-specific numbers look like right now?
WordPress Market Share
Despite the decline in CMS market share, WordPress still powers more websites than every other CMS combined.
- ~39.5% of all websites run on WordPress as of October 2026 (W3Techs, 2026).
- ~59.1% of sites with a known CMS use WordPress (WPZOOM, 2026).
- ~605 million total WordPress sites (including parked/inactive), 37.5 million actively visited (BacktoFrontShow, 2026).
- Elementor is used on 31.5% of WordPress sites, and WooCommerce on 19.8%.
- 70 million new posts and 77 million new comments are published on WordPress every month (Colorlib, 2026).
- Over 10,000 WordPress sites go live every day using Hostinger alone (Hostinger, 2026).
Those numbers look different when you filter by traffic. Among the top 10,000 highest-traffic sites, WordPress accounts for roughly 58% of CMS usage. Shopify and Wix barely register in that tier.
So while WordPress is losing ground in the broader market, large organizations are still building on it.
WordPress Plugin Ecosystem
The plugin ecosystem is what makes WordPress so flexible. With over 68,000 free plugins in just the official repository, site owners can add everything from contact forms to full ecommerce stores without writing a line of code (WordPress, 2026).
- 70,000 total plugins, including premium marketplace options (HostingGuider, 2026)
- 57% of plugins have zero user reviews (StackedReview, 2026).
- 91% of all WordPress vulnerabilities originate in plugins (Wordfence, 2025)
- 45.6% of all plugins have not been updated in two or more years (WPGoldmine, 2026).
- 1,614 plugins and themes were removed from the WordPress repository for unpatched security issues (Patchstack, 2025).
Over half the catalog is already gathering dust, and each outdated plugin is a potential entry point for attackers. In 2023 alone, Patchstack reported 827 vulnerable plugins to the WordPress team, and 481 of them were simply removed because no developer existed to fix them (DreamHost, 2026).
Our team at WP Guard monitors plugin health on every site we manage for exactly this reason. An abandoned plugin with a known vulnerability can sit unpatched for months before a site owner even notices.
WordPress Security and Vulnerabilities
WordPress powers four in ten websites, which makes it the single biggest target on the web. Almost all of that risk traces back to the plugin ecosystem we just covered.
| Statistic | Number |
| New vulnerabilities discovered in 2025 | 11,334 |
| Vulnerabilities in plugins | 91% |
| Vulnerabilities in themes | 9% |
| Vulnerabilities in WordPress core | Only 6 |
| XSS as a percentage of all vulnerabilities | 47.7% |
| Exploitable without authentication | 43% |
| Median time from disclosure to exploitation | 5 hours |
| Exploited within 72 hours of disclosure | 58% |
| No developer patch at time of disclosure | 46% |
| Plugin vulnerabilities disclosed per week in 2026 | 250+ |
Sources: Patchstack (2026), UnfoldCMS (2026)
These aren’t hypothetical risks. In fact, several major incidents have already happened in 2026:
- In April, attackers gained push access to 25 plugins on WordPress.org over 72 hours. Three were sold to malicious buyers, and eight had developer accounts compromised through credential stuffing (UnfoldCMS, 2026).
- 83 WPFactory plugins were removed in a single hour after researchers found data exfiltration code that bypassed SSL verification (AWP Life, 2026).
- 70% of WordPress sites currently run end-of-life PHP versions (SecurityOnline, 2026).
- Fewer than 22% of sites running Yoast SEO had the latest version installed (SecurityOnline, 2026).
However, the WordPress core itself is well-maintained. Version 7.0 shipped on May 20, 2026, followed by 7.0.1 on July 9 and 7.0.2 on July 17 (WordPress.org, 2026). So, the problem isn’t the platform. It’s the 60,000 plugins and themes that site owners add on top of it.
The average cost of a hacked website was $2,518, including downtime, lost revenue, and repair costs (Wordfence, 2026). For context, a year of proactive WordPress security and maintenance through WP Guard costs less than what most businesses spend on a single incident response.
Shopify Market Share
Shopify is the second-largest CMS and the go-to platform for online stores. While WordPress grew through flexibility, Shopify grew by doing one thing well: ecommerce.

- ~5.1% of all websites and 7.2% of the CMS market (W3Techs, 2026).
- 4.6–4.8 million live stores worldwide (Colorlib, 2026).
- $11.56 billion in revenue in 2025, a 30% increase year-over-year (SEJ, 2025).
- Holds 26–29% of the ecommerce CMS market.
- Grew roughly 1,600% since 2015, from 0.3% to 5.1%.
- 75–78% Core Web Vitals pass rate, second among major CMS platforms.
Shopify is largely absent from the top 10,000 highest-traffic sites (WPZOOM, 2026). Its strength lies in the small- to mid-sized business segment, where site owners want a managed platform that handles hosting, security, and payments out of the box.
Wix Market Share
Wix is the fastest-growing major CMS right now, and it’s no longer just a drag-and-drop builder for hobby sites.

- Used on ~4.3% of all websites, holding 6.0% CMS market share (W3Techs, 2026).
- 2.9 million live websites globally (Colorlib, 2026).
- $1.99 billion in revenue in 2025 (SEJ, 2025).
- 43x growth since 2015, from 0.1% to 4.3%.
- 71–75% Core Web Vitals pass rate, up 14 percentage points in a single year.
- Lighthouse mobile performance score of 64, compared to WordPress’s 41.
Like Shopify, Wix barely registers among the top 10,000 highest-traffic sites. But its year-over-year growth rate tells a different story at the small business level.
Basically, business owners who don’t want to manage plugins, hosting, and security separately are choosing Wix over WordPress in growing numbers.
Squarespace, Joomla, and Drupal Market Share
Unfortunately, not every CMS is trending upward. These three platforms tell very different stories, but none of them are keeping pace with the SaaS growth we covered above.
Squarespace
If you’ve ever seen a sleek portfolio site or a minimalist online store, there’s a good chance it runs on Squarespace. The platform built its reputation on design, and it’s still growing because of it.

- Covers 2.5% of all websites and holds 3.5% of the CMS market (Colorlib, 2026).
- Grew from 0.2% in 2015 to 2.5% in 2026 (W3Techs, 2026).
- Acquired by private equity firm Permira for $7.2 billion in October 2024 (SEJ, 2025).
- Ranks #1 among all major CMS platforms for INP (responsiveness) at a 96% pass rate.
- Average SEO score of 40.5 out of 100, with 66.4% of Squarespace sites missing alt text.
The $7.2 billion acquisition signals investor confidence in the SaaS CMS model, even for a platform with a relatively small market share.
Joomla
Joomla was once a real contender. It launched in 2005, gained traction with developers who wanted more structure than WordPress offered, and around 2008 it briefly surpassed WordPress in Google search interest (Joomla, 2025).
Since then, the platform has struggled to keep up with both WordPress’s plugin ecosystem and the simplicity of SaaS builders. You wouldn’t know it looking at the numbers today.

- Currently sits at 1.3% of all websites and 1.8% of the CMS market (Colorlib, 2026).
- Down 61% from 3.3% in 2015 (W3Techs, 2026).
- Lost 20% of its market share since 2024 alone (SEJ, 2025).
- Highest image weight among major CMS platforms at 1,612 KB on mobile.
Drupal
Drupal’s overall numbers are small, but it still holds weight where it counts.

- Sits at 0.7% of all websites and 1.0% CMS market share (Colorlib, 2026).
- Down 70% from its 2018 peak of 2.3% (W3Techs, 2026).
- Holds 6–7% among the top 10,000 highest-traffic sites, well above its overall share (WPZOOM, 2026).
Government agencies, universities, and large nonprofits still rely on Drupal for its granular access controls and multi-site management. But for new projects, fewer organizations are choosing it.
Ecommerce CMS Market Share
Ecommerce is where the CMS competition gets the most intense. In fact, WooCommerce and Shopify together control over 60% of the online store market, but they serve very different types of sellers.
| Platform | Ecommerce Share | Live Stores |
| WooCommerce | 33–37% | 4.53 million |
| Shopify | 26–29% | 4.6–4.8 million |
| Wix Stores | ~14–16% | 2.9 million |
| Squarespace | ~9–11% | ~393,000 |
| Magento/Adobe Commerce | ~7% | ~110,000 |
| OpenCart | ~4% | ~165,000 |
| PrestaShop | ~3% | ~156,000 |
| BigCommerce | ~1% | ~37,000 |
Sources: Red Stag (2026), Colorlib (2026), Coalition Technologies (2026), StoreLeads (2026)
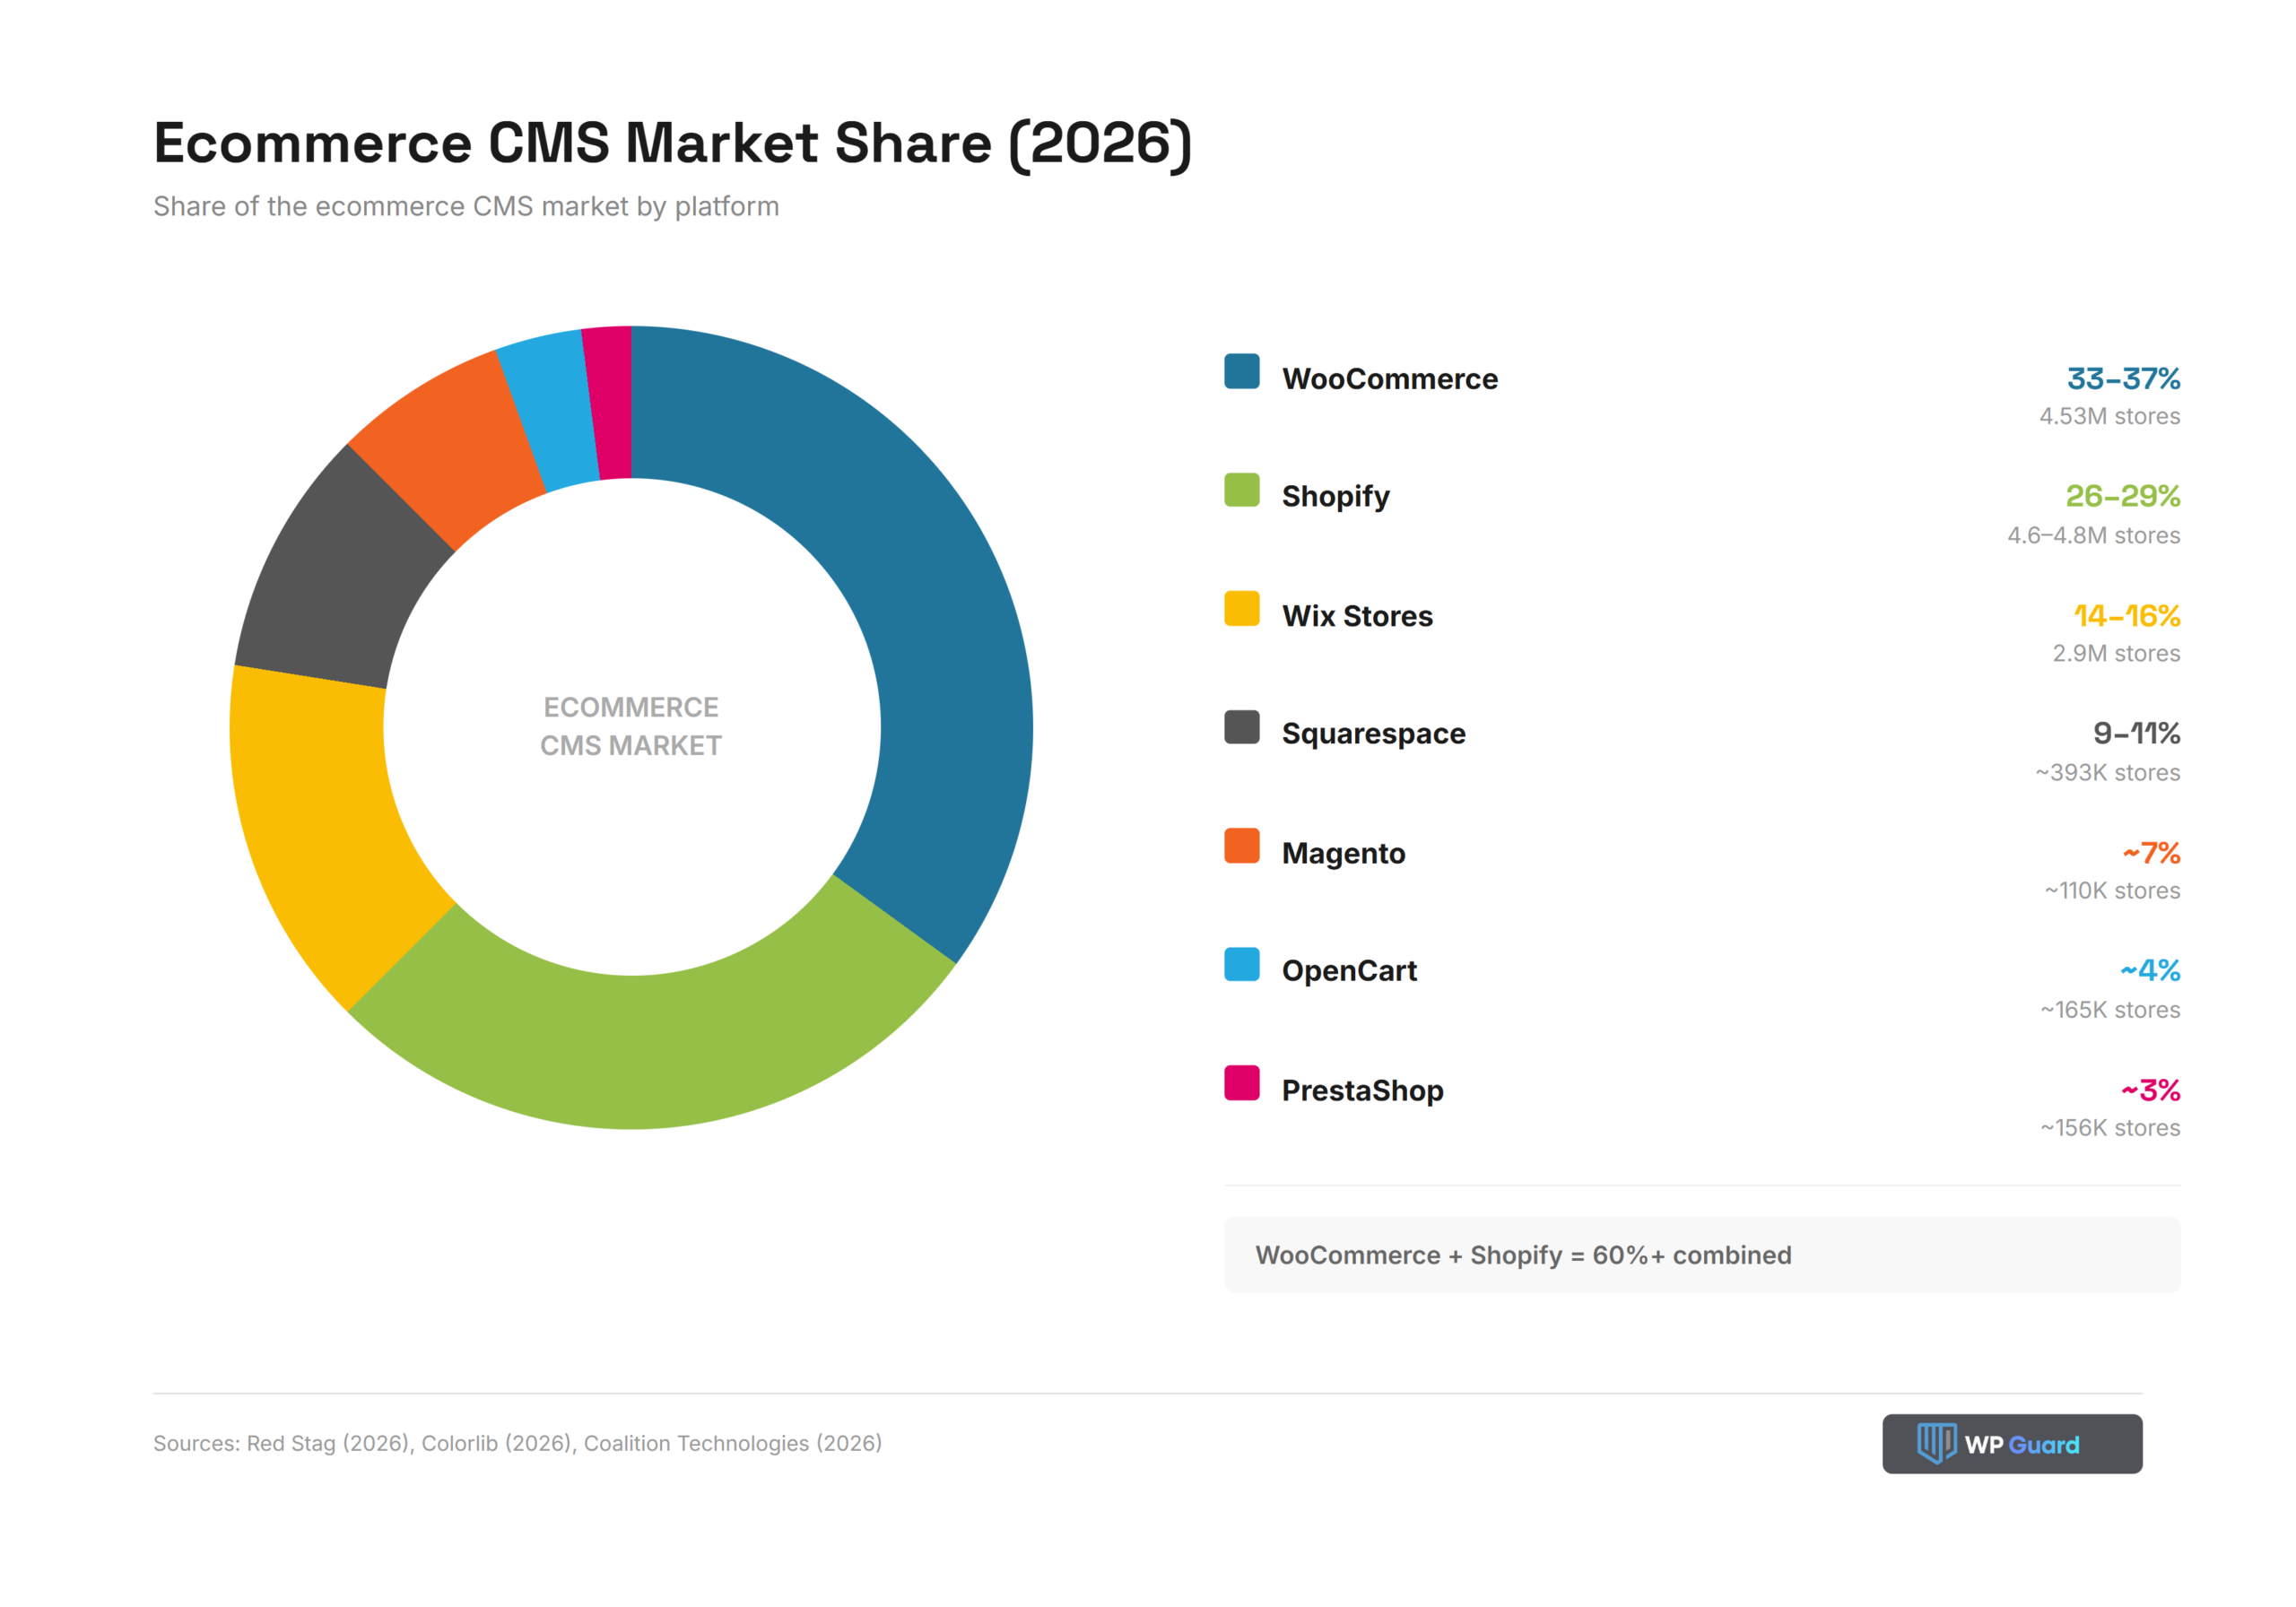
WooCommerce has a larger market share, but Shopify has more live stores. Since WooCommerce runs as a plugin on WordPress, many of those installations sit on sites that also serve non-ecommerce purposes. Shopify stores, on the other hand, are built specifically to sell.
Magento tells a similar story to Drupal in the general CMS market. Its overall share is small at ~7%, but it punches above its weight among high-revenue merchants and holds ~9% of the top 1 million ecommerce sites (MobiLoud, 2026). PrestaShop and OpenCart have niche footholds in Europe and Latin America, respectively.
Over 55% of new ecommerce stores in 2025 launched on SaaS platforms rather than self-hosted options. The same pattern from the broader CMS market shows up here: managed platforms are winning new business.
CMS Performance Benchmarks (Core Web Vitals)
Google uses Core Web Vitals to measure how your site performs for real users. A site needs to pass all three to get a “good” rating, and these scores directly affect search rankings.
| CMS | CWV Pass Rate | INP | LCP | CLS |
| Shopify | 75–78% | 89% | — | — |
| Wix | 71–75% | 87% | 81% | 95% |
| Squarespace | 68% | 96% | — | 89% |
| WordPress | 43–45% | 86% | 53% | 84% |
Sources: HTTP Archive 2025 Web Almanac (2025), Colorlib (2026)
WordPress sits at the bottom of this list, and it might seem like a fault, but it requires context.
The platform runs on 40% of all websites, including millions with unoptimized themes, heavy plugins, and cheap shared hosting. So, a WordPress site with proper caching and a lightweight theme can pass Core Web Vitals without issues.
The SaaS platforms don’t have that problem because they control the entire stack. Wix improved its pass rate by 14 percentage points in a single year, and its median mobile page weight sits at just 194 KB (Colorlib, 2026). WordPress’s median is 2,894 KB, nearly 15x heavier.
For site owners who don’t want to manage performance optimization on their own, that gap is a major reason many are moving to SaaS builders.
CMS Revenue and Market Size
The CMS market isn’t just growing in adoption. The revenue behind these platforms has scaled just as aggressively, and the gap between the top players is much wider than the market share data suggests.
| Metric | Value |
| CMS market size (2025) | $34.94 billion |
| CMS market size (2026 est.) | $38.5 billion |
| CMS market projected (2033) | $77.77 billion |
| CAGR (2026–2033) | 10.6% |
| Shopify revenue (2025) | $11.56 billion (+30% YoY) |
| Wix revenue (2025) | $1.99 billion |
| WordPress ecosystem economy | $596.7 billion |
| Squarespace acquisition value | $7.2 billion (Permira, Oct 2024) |
Sources: Grand View Research (2026), SEJ (2025), Colorlib (2026)
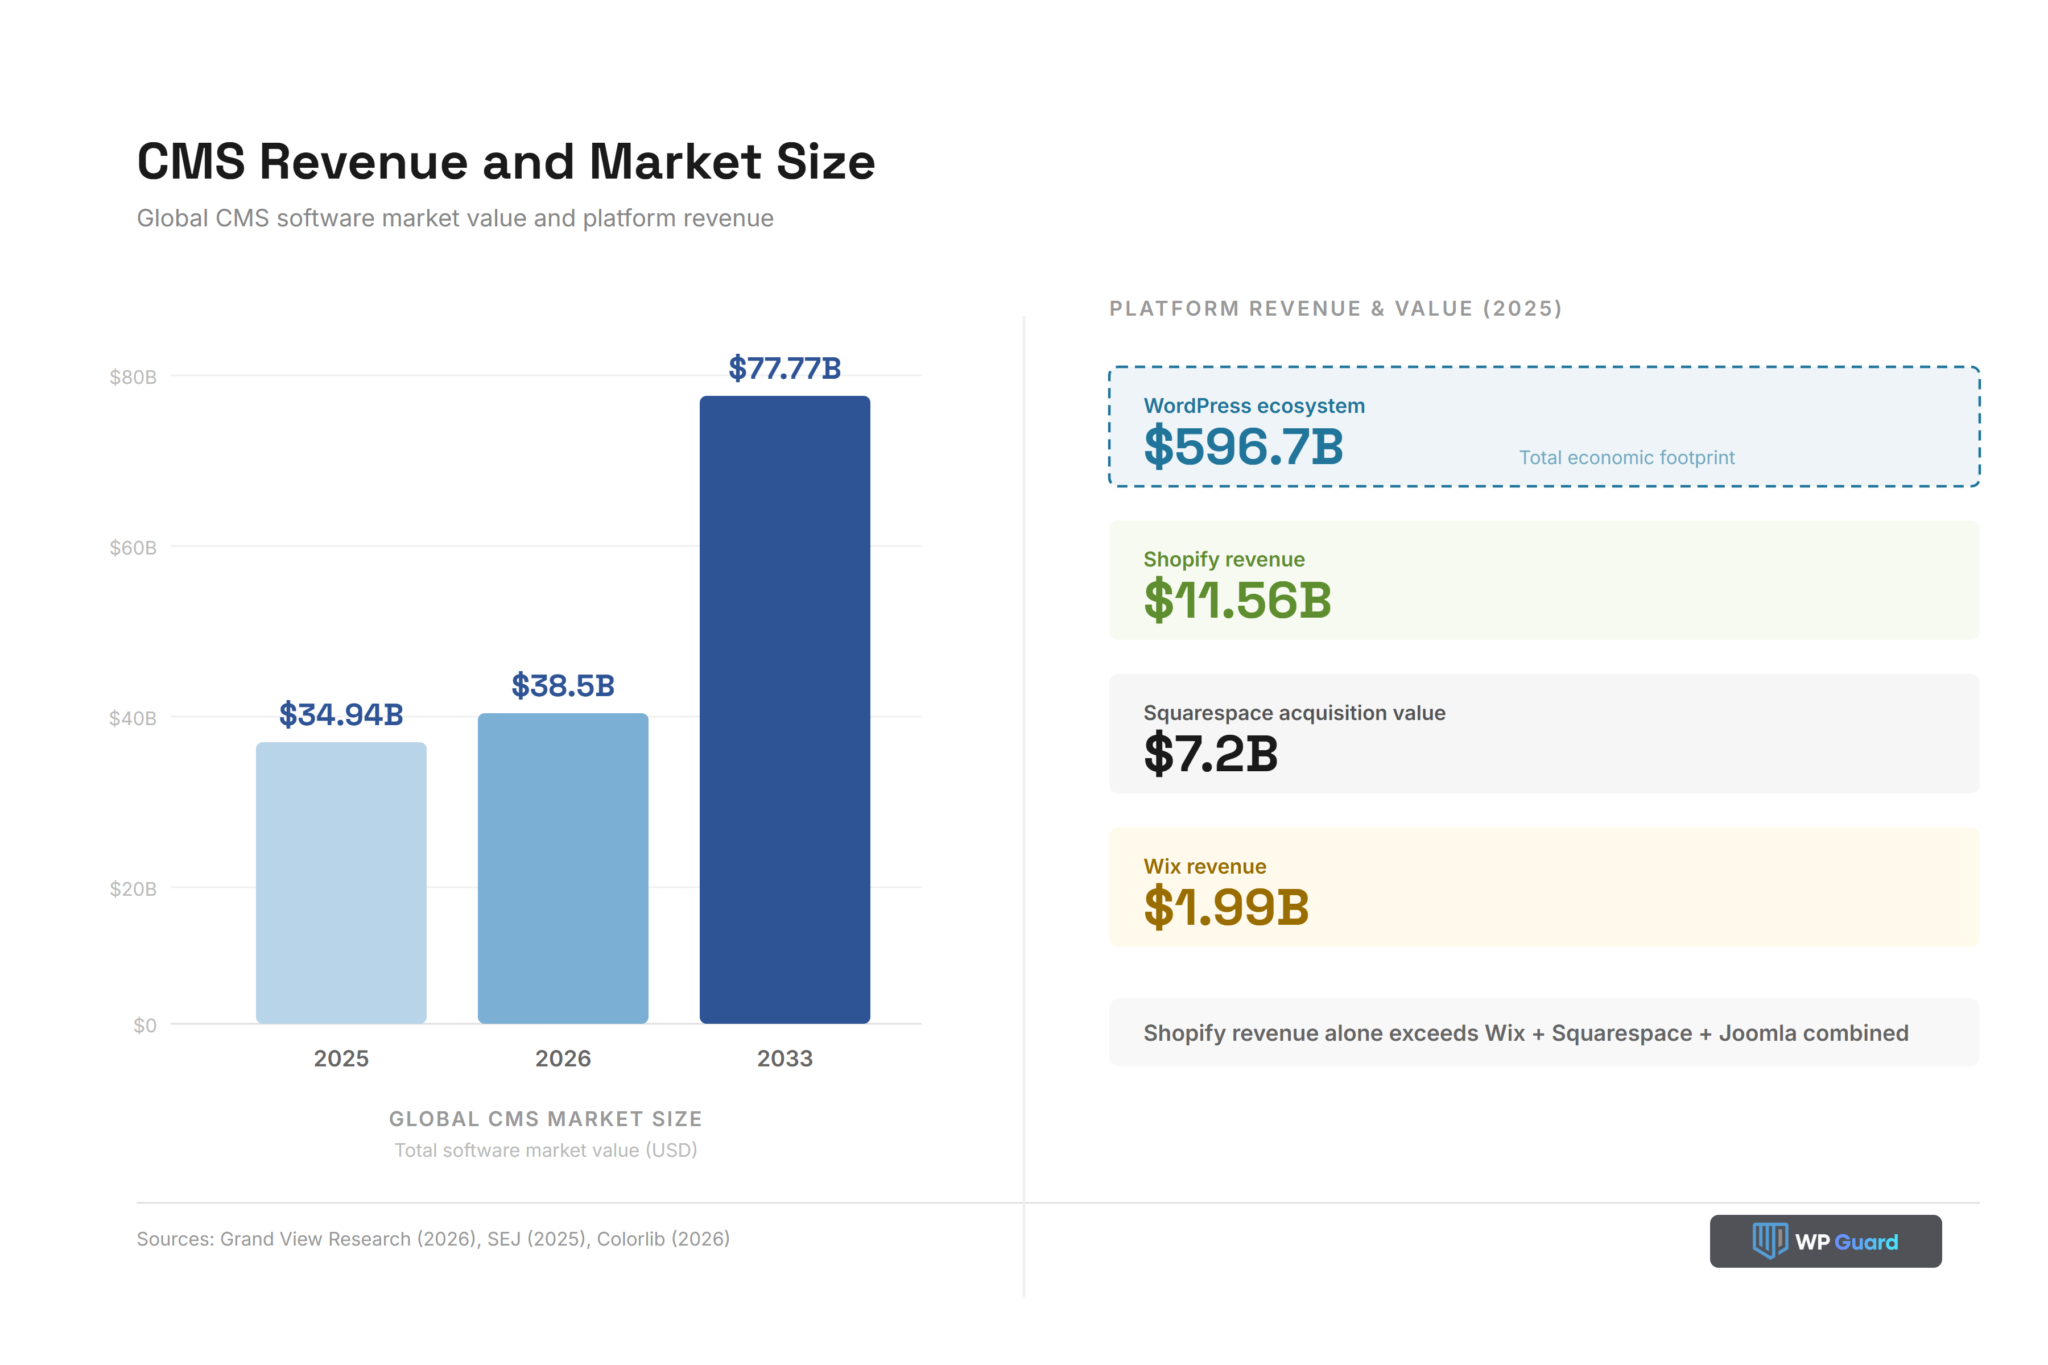
The WordPress ecosystem tells a different story from any single company’s revenue. When you add up themes, plugins, hosting providers, and agencies built around WordPress, the total economy reaches $596.7 billion (Colorlib, 2026).
No other CMS platform comes close to that kind of economic footprint.
CMS Market Share in 2026: Where Things Stand
WordPress still powers four in ten websites, but the trend line has shifted. For the first time in over two decades, the platform is losing share rather than gaining it, and SaaS builders are picking up the difference.
That said, WordPress isn’t going anywhere. It still dominates the top 10,000 highest-traffic sites, its plugin ecosystem is unmatched in size, and version 7.0 shows the core software is actively maintained. The vulnerability problem is there, but it’s a plugin problem, not a WordPress problem.
For site owners sticking with WordPress, the data in this article points to one priority: stay on top of your plugins, updates, and security. If you’d rather not manage that yourself, that’s what our team at WP Guard is here for.
Sources and Methodology
Every data point in this article is sourced and linked. This section explains where the numbers come from, how they were collected, and what the limitations are.
Primary Data Source
The market share figures in this article come from W3Techs, which surveys the top 10 million websites ranked by Tranco. W3Techs reports two separate metrics:
- % of all websites: Each platform’s share of the entire web, including sites with no CMS
- CMS market share: Each platform’s share among websites that use a known CMS only
Both metrics appear in this article. We specify which one is being used in each instance.
How the Data Was Collected
Historical figures use January 1 snapshots for each year. The Oct 2026 figures are mid-year live readings. W3Techs auto-updates daily, so exact numbers may shift slightly depending on when you check.
We cross-verified W3Techs data against these secondary sources:
- Colorlib (March 2026)
- Search Engine Journal (October 2025)
- WPZOOM (August 2026)
- WPPoland (July 2026)
- CMSConf (December 2025)
- Kinsta (December 2024)
- BacktoFrontShow (2026)
Other Data Sources
- Security and vulnerability data: Patchstack (2026), UnfoldCMS (2026), Wordfence (2026), SecurityOnline (2026)
- CMS market size and revenue: Grand View Research (June 2026)
- Performance benchmarks: HTTP Archive 2025 Web Almanac
- Plugin ecosystem data: HostingGuider (2026), DiviFlash (2026), AWP Life (2026), WPGoldmine (2026), StackedReview (2026), DreamHost (2026)
- Ecommerce CMS data: Red Stag (2026), Yaguara (2026), Coalition Technologies (2026), MobiLoud (2026)
- Migration survey: TechRadar / Liquid Web (May 2025)
- WordPress release history: WordPress.org (2026)
Limitations
W3Techs only surveys the top 10 million sites by traffic ranking. Smaller sites, parked domains, and private intranets are excluded. BuiltWith uses a broader scan of live websites, which is why their raw counts differ from W3Techs percentages.