WP2Shell Attack Analysis
Most WP2Shell coverage answers the same question: “How does the exploit work?” But we are more interested in what happened next. “Did the patch hold up across 220 real WordPress sites, or were attackers still finding a way in?”
To find the answer, our WP Guard team ran our own checker script against a representative sample of our managed fleet of WP Websites after the vulnerability WP2Shell was disclosed on July 17, 2026. We then filtered the log noise, manually verified every flagged account, and monitored how the exploit evolved over the following 11 days.
The results below come directly from our analysis, and you can reproduce them using the checker script published alongside this article. You can also use this guide to:
- Run the same checker against your own fleet and get a real pass/fail without a guess
- Correct your own attempt counts if you’ve been using the broad indicators of compromise (IOCs) list circulating in advisories
- Decide whether HTTP 207 responses in your logs warrant further investigation
Let’s get started.
Key Takeaways
- 88.6% of our fleet patched the same day WP2Shell was disclosed. Attackers made their first confirmed attempt the following day.
- Attackers targeted only 11 of our 220 sites before we patched them. Zero were compromised.
- Raw log scans recorded 135,502 apparent “attack” hits. After filtering unrelated traffic, we identified 12,145 genuine attempts, which shows that raw counts overstated activity by roughly 10x.
- Attackers changed the exploit tooling four times over the following 11 days and adopted a browser-like user agent by day four.
- Wiz’s public research identifies a 207 Multi-Status response as a high-fidelity indicator of compromise. But our fleet data tells a different story, and we explain why in the following sections.
What Was Actually at Risk
WP2Shell is a two-chain vulnerability, CVE-2026-63030 and CVE-2026-60137, and exposure depended entirely on which version a site was running.
| WordPress version | Exposure | Fixed in |
| 6.8.0–6.8.5 | SQL injection only, no full chain | 6.8.6 |
| 6.9.0–6.9.4 | Full pre-auth remote code execution | 6.9.5 |
| 7.0.0–7.0.1 | Full pre-auth remote code execution | 7.0.2 |
Every site in our sample set fell somewhere on this table. If your own site does too, our findings apply directly. If it’s already on 6.8.6, 6.9.5, or 7.0.2 and later, this specific chain never reached it.
Dataset: The Fleet We Checked
We checked every WordPress installation across our managed fleet: 30 servers hosting 220 sites. One server was unreachable, so we excluded it from the analysis. Every installation ran Ubuntu and nginx under SpinupWP with WordPress core auto-updates enabled.
This is the scope of what we checked, in full:
| Metric | Value |
| Servers targeted | 30 |
| Servers with usable data | 29 |
| Servers with no data at all | 1 (SSH/SCP failure) |
| WordPress installs checked | 220 |
| Hosting stack | Ubuntu / nginx / SpinupWP |
| Core auto-updates | On, fleet-wide |
| Log window analyzed | July 18–28, 2026 (11 days post-disclosure) |
To protect client privacy, we don’t name any client sites in this article. Every domain is anonymized, and every screenshot has hostnames and paths redacted. Our analysis focuses on the observed patterns rather than individual websites.
Here’s the same check, run server-by-server across the fleet. The data below comes straight from wp2shell-check.sh and the script we’re publishing further down, with hostnames and IPs redacted for this article.
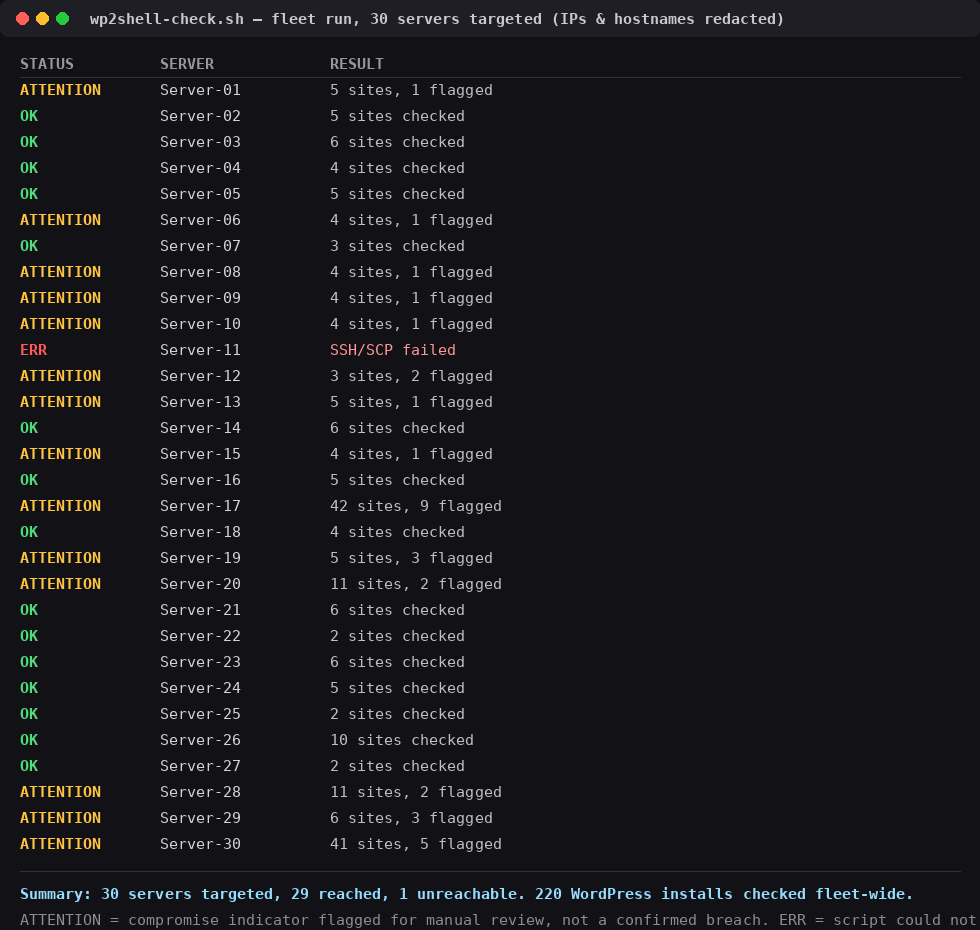
Note: This visual was generated by the WP Guard team from the script’s real output, then we reformatted it for readability. However, running wp2shell-check .sh yourself will print this same data as plain text in your terminal, not as a styled table.
The log evidence above covers the 11 days following the WP2Shell disclosure, from July 18 to July 28, 2026. Most hosts retain older logs, but log rotation prevents us from confirming earlier exposure with the same level of certainty. We’ll highlight that limitation again wherever it affects our findings.
Keep in Mind: We analyzed a single hosting environment with WordPress core auto-updates enabled, so the patch-speed figures below apply only to that setup.
Finding One: The Patch Outran the Exploit Wave
The patch came first, and the data shows it.
Across our fleet:
- July 17, 2026 (disclosure day): 195 of 220 sites (88.6%) were already running a patched WordPress core.
- Within 48 hours: Nine more sites patched and raised coverage to 92.7%.
- July 21: Four days after disclosure, 218 of 220 sites had been patched.
- July 27: The final two sites patched, including one development/staging installation.
The first confirmed exploitation attempt reached the fleet on July 18, one day after disclosure. By then, we had already patched most of the fleet before a single confirmed attack arrived.
Here’s the patch curve against the exploit wave, day by day:
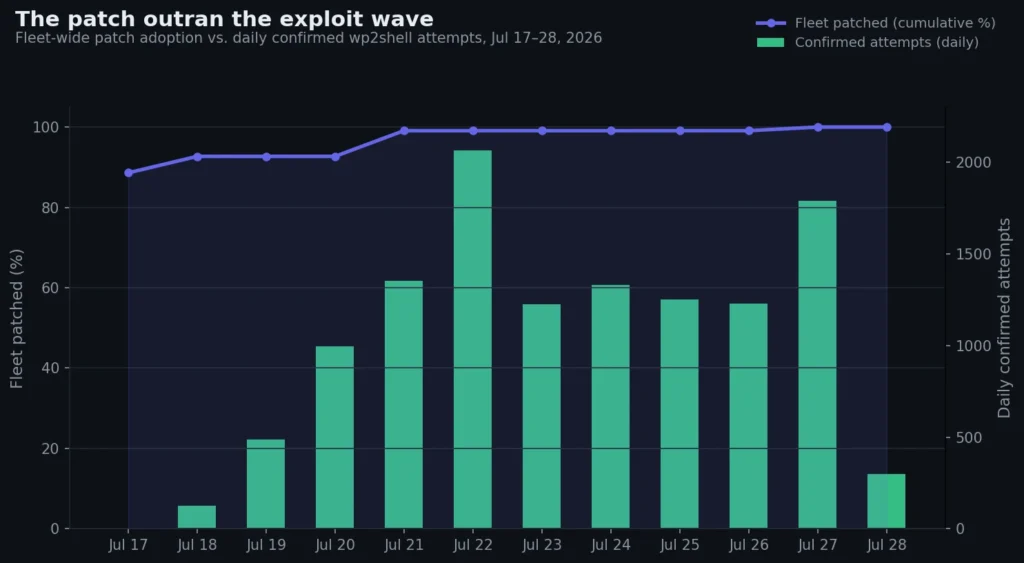
The attacks didn’t stop after disclosure.
Eleven days later, our fleet was still absorbing 1,200 to 1,800 confirmed exploitation attempts each day. And the attack volume remained steady throughout the final week of this dataset, well beyond the initial news cycle.
Despite that sustained activity:
- Only 11 of 220 sites (5%) received attack attempts before patching.
- Those 11 sites received 260 confirmed attempts during their actual exposure windows.
- None of those attempts resulted in a compromise.
We explain how we verified the outcome of point three.
The thing is, these results come from a single managed fleet with WordPress core auto-updates already enabled. So they don’t represent every WordPress deployment.
They do, however, demonstrate what automatic updates achieved in this environment. In our fleet, allowing the update to install automatically closed almost every exposure window before attackers reached the site.
Now, Check Your Own Timing
You don’t need our fleet data to answer this question for your own site. The starting point is already public: the first confirmed exploitation attempt against our fleet arrived on July 18, 2026. Now, you can compare your site’s patch timing against that date.
Generally, every patched WordPress installation records its patch time in a single file: wp-includes/version.php. WordPress rewrites this file as soon as the update finishes, and the file’s modification timestamp marks the patch time.
Once you compare that timestamp to July 18, you’ll know whether your site was patched before attackers arrived or during the attack wave.
The script below performs that timestamp check automatically for a single site or an entire list, with no log parsing required:
#!/usr/bin/env bash
# wp2shell-patch-timing.sh — did your patch land before the exploit wave?
# Wave start (first confirmed attempts, per this dataset): 2026-07-18

WAVE_START="2026-07-18 00:00:00"
WAVE_START_EPOCH=$(date -d "$WAVE_START" +%s)

for path in "$@"; do
  patched_at=$(stat -c %y "$path/wp-includes/version.php" 2>/dev/null | cut -d. -f1)
  [ -z "$patched_at" ] && { echo "$path: could not read patch time"; continue; }
  patched_epoch=$(date -d "$patched_at" +%s)

  if [ "$patched_epoch" -lt "$WAVE_START_EPOCH" ]; then
    hours_ahead=$(( (WAVE_START_EPOCH - patched_epoch) / 3600 ))
    echo "$path: patched $patched_at — ${hours_ahead}h before the wave started. Outran it."
  else
    hours_behind=$(( (patched_epoch - WAVE_START_EPOCH) / 3600 ))
    echo "$path: patched $patched_at — ${hours_behind}h after the wave started. Check logs for pre-patch attempts."
  fi
done
Run it against one site, or pass every install path on your server at once:
./wp2shell-patch-timing.sh /var/www/site1 /var/www/site2 /var/www/site3
Note: This checks a file timestamp rather than a changelog. For that reason, if your site went through a migration, restore, or rsync since patching, that timestamp may not reflect the real patch date. So if the result looks wrong, check your update logs directly instead of trusting the file alone.
A result showing your site was patched before July 18 doesn’t mean attackers never scanned it. Instead, it may indicate WordPress had already applied the patch before the attack wave reached your site.
Pro Tip: If the result shows your site patched after July 18, review your logs for activity during the exposure window.
And finding three will explain how to do that.
Finding Two: Attempt Counts Inflated by 10x
Our first count returned 135,502 apparent WP2Shell attack hits across the fleet. But that figure turned out to be heavily inflated, and understanding why is more valuable than the raw number itself.
We grepped our access logs for every indicator circulating in public advisories: the batch endpoint paths, the leakix scanner signature, known malicious user agents, and the author__not_in parameter. That search returned matches going back to 2023, three years before this CVE existed. A number that old can’t possibly be measuring an attack that started in July 2026.
We searched our access logs for every indicator published in public advisories, including the batch endpoint paths, the leakix scanner signature, known malicious user agents, and the author__not_in parameter.
The search returned matches dating back to 2023, three years before WP2Shell was disclosed. Those earlier entries couldn’t represent WP2Shell activity, so the raw count clearly included unrelated traffic.
Two sources accounted for almost all of the inflation:
- leakix scanner traffic
- Legitimate batch endpoint requests
The breakdown below shows how those sources compare with the 12,145 confirmed exploitation attempts.
| Category | Hits | What it actually is |
| leakix scanner traffic | 75,892 | A general internet research scanner that’s crawled these sites for years, unrelated to this CVE |
| /wp-json/batch/v1 traffic | 47,548 | A legitimate WordPress core endpoint since version 5.6, used constantly by the block editor for routine bulk saves |
| Real wp2shell attempts | 12,145 | Wp2shell-branded user agents, the CVE signature, or a genuine author__not_in payload |
| Raw, unfiltered total | 135,502 | What a naive log search returns without removing the two rows above |
Once you stack those two sources against the number, the gap is obvious at a glance:
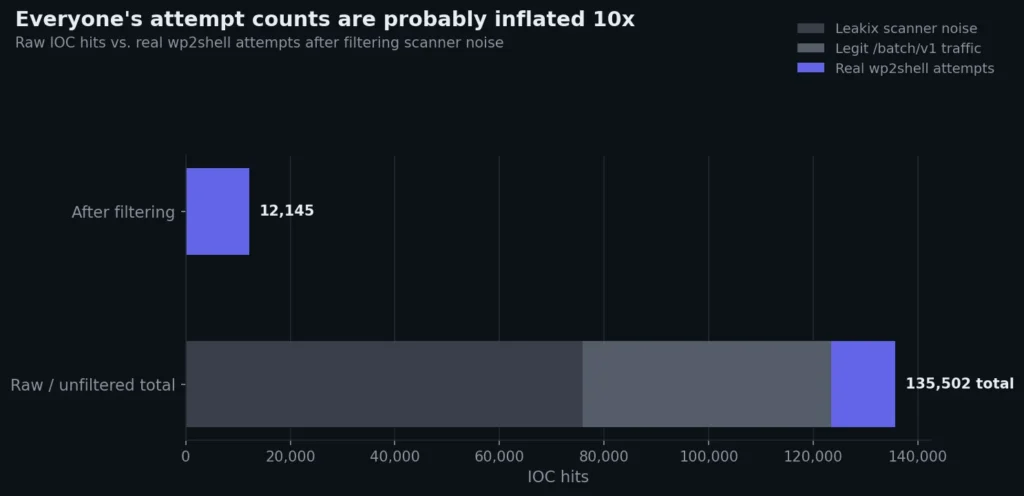
After removing unrelated traffic and filtering for unambiguous WP2Shell exploitation attempts, the apparent attack count dropped from 135,502 to 12,145. That’s a 10x gap between what a quick log search shows and what actually happened.
Further, we validated the filter by checking the timeline. The earliest entry in the filtered dataset appeared on July 18, 2026, one day after disclosure, with no earlier matches. In contrast, the unfiltered dataset stretched back to 2023, well before the vulnerability existed. That pattern indicates background noise rather than a campaign tied to the July 2026 disclosure.
Check Your Own Logs
If you’ve counted WP2Shell attempts in your own access logs and the number seemed unusually high, there’s a good chance it includes leakix scans and legitimate /batch/v1 requests.
The script below applies the same broad-versus-strict filtering we used in our analysis, which helps you separate confirmed exploitation attempts from unrelated background traffic:
#!/usr/bin/env bash
# wp2shell-ioc-filter.sh — separate real wp2shell attempts from noise
# Usage: cat access.log | ./wp2shell-ioc-filter.sh

IOC_STRICT='wp2shell|cve-2026-63030|rezwp2shell|author__not_in'
IOC_BROAD='rest_route=/batch/v1|/wp-json/batch/v1|leakix'

echo "Reading from stdin..."
LOGDATA=$(cat)

STRICT_COUNT=$(echo "$LOGDATA" | grep -aiE "$IOC_STRICT" | wc -l)
BROAD_COUNT=$(echo "$LOGDATA" | grep -aicE "$IOC_BROAD")
TOTAL=$((STRICT_COUNT + BROAD_COUNT))

echo ""
echo "Real wp2shell attempts (strict):  $STRICT_COUNT"
echo "Noise (batch/v1 + leakix):        $BROAD_COUNT"
echo "Naive total if unfiltered:        $TOTAL"
echo ""
if [ "$STRICT_COUNT" -gt 0 ]; then
  INFLATION=$(echo "scale=1; $TOTAL / $STRICT_COUNT" | bc 2>/dev/null || echo "N/A")
  echo "Inflation factor: ${INFLATION}x"
fi
Run it against any access log:
cat /var/log/nginx/access.log | ./wp2shell-ioc-filter.sh
Note: This filter reflects the tooling and request patterns we observed during this campaign. Attackers have already changed their signatures at least once, as Finding Three shows, so you may need to update the pattern list as the campaign evolves.
But you can treat it as a starting point for your own analysis rather than a permanent detection rule.
Suggestion: When you read a report that quotes a CVE attempt count, including this one, it’s worth asking how the authors produced it. It’s because counts based on a raw grep of public IOCs are likely to include unrelated traffic and can substantially overstate the level of attack activity.
Finding Three: Exploit Tooling Changed 4 Times in 11 Days
Other researchers have already shown that WP2Shell attackers vary their user agents. For example, ELLIO documented a single attacker cycling through 42 different user-agent strings in a single day, including several designed to resemble ordinary browser traffic.
But our fleet data answers a different question. Instead of capturing one attacker’s behavior during a single session, it shows: “When each version of the tooling appeared across the campaign?” And that timeline lets us track how the exploit evolved over the first 11 days after disclosure.
The table below follows those changes in the order we first observed them.
| User agent | Attempts | First seen | Last seen |
| wp2shell | 8,143 | Jul 18 | Jul 28 |
| wp2shell/4.0 | 1,672 | Jul 21 | Jul 28 |
| Mozilla/5.0 (compatible; wp2shell-check/1.0) | 1,037 | Jul 20 | Jul 28 |
| wp2shell-rce/1.0 | 221 | Jul 19 | Jul 27 |
| wp2shell-checker | 218 | Jul 20 | Jul 24 |
| wp2shell-evolved-PoC/2.0 | 204 | Jul 19 | Jul 23 |
| cve-2026-63030/1.0 | 127 | Jul 19 | Jul 26 |
| rezwp2shell | 53 | Jul 19 | Jul 26 |
Note: These eight variants were the busiest of the 24 distinct user agents we tracked, accounting for 11,675 of the 12,145 strict matches. The remaining 16 (each seen far less often) are listed in full in the companion dataset on GitHub.
The user-agent timeline shows how quickly the tooling evolved:
- Day 1: wp2shell and wp2shell/2.0 both appeared.
- Day 2: -evolved-PoC/2.0 appeared.
- Day 4: wp2shell/4.0 replaced the earlier versions.
- Days 4-11: wp2shell/4.0 remained the dominant version.
- Mid-campaign: The tooling adopted a Mozilla/5.0 (compatible; …) prefix to make exploit traffic resemble ordinary browser requests.
Interestingly, none of these user-agent strings is new. Several already appear in public IOC lists. What’s new is the timeline. And mapping the strings against first-seen dates across the same fleet shows that the tooling evolved throughout the campaign rather than remaining static (new versions continued to appear for eleven days after disclosure).
Check Your Own Logs Against This List
The user-agent list changed rapidly during the first eleven days after disclosure. The script below checks your access logs against all eight variants we tracked to help you identify which ones, if any, reached your site.
#!/usr/bin/env bash
# wp2shell-ua-check.sh — check your logs against known wp2shell UA variants
# Usage: cat access.log | ./wp2shell-ua-check.sh

declare -A UAS=(
  ["wp2shell"]="bare, first seen Jul 18"
  ["wp2shell/4.0"]="versioned, first seen Jul 21, still active"
  ["wp2shell-check/1.0"]="disguised behind Mozilla prefix, first seen Jul 20"
  ["wp2shell-rce/1.0"]="first seen Jul 19"
  ["wp2shell-checker"]="first seen Jul 20"
  ["wp2shell-evolved-PoC/2.0"]="first seen Jul 19"
  ["cve-2026-63030"]="CVE-labeled, first seen Jul 19"
  ["rezwp2shell"]="first seen Jul 19"
)

LOGDATA=$(cat)
echo "Checking against 8 known wp2shell UA variants..."
echo ""
for ua in "${!UAS[@]}"; do
  count=$(echo "$LOGDATA" | grep -aic "$ua")
  [ "$count" -gt 0 ] && echo "FOUND: \"$ua\" — $count hits (${UAS[$ua]})"
done
echo ""
echo "Note: this list reflects known variants as of this dataset's collection date."
echo "Attackers have already updated tooling once; expect more variants over time."
However, this list will age the same way the exploit tooling did. So treat a match as confirmation that your site was targeted by one of the tracked variants. Not as a complete inventory of every variant that may have circulated by the time you’re reading this.
Where We Differ From Wiz on 207 Responses
Wiz’s public research on wp2shell, published on July 20, 2026, identifies HTTP 200 and 207 Multi-Status responses from the batch endpoint as relatively high-fidelity indicators of successful exploitation. Bitdefender’s technical advisory says nearly the same thing, describing 207 as a high-fidelity indicator of exploitation attempts.
Our fleet data supports part of that conclusion but adds an important qualification.
Where They’re Right
On a site that’s genuinely still vulnerable, with no other explanation for the traffic, a 207 from the batch endpoint can be exactly the signal Wiz and Bitdefender describe. Their research reflects real compromises on real unpatched sites.
And a published incident report catches them too. A Wordfence alert recorded the creation of a new administrator account named wpenginebot on a still-vulnerable installation, two days before the site was patched.
Where It Breaks Down
Across our fleet, patched sites with no evidence of WP2Shell exploitation also logged 207 Multi-Status responses from the same endpoint. That’s because the WordPress block editor uses HTTP 207 during legitimate bulk save operations. WordPress has used this status code for valid multi-request operations since version 5.6, independent of any exploitation attempt.
The difference lies in how anyone measures the environment. For example, on a confirmed vulnerable site with no alternative explanation for the request, an HTTP 207 can be a useful indicator. But across a mixed fleet of patched and unpatched sites, the same status code no longer distinguishes malicious requests from normal activity.
What distinguishes the two situations is the evidence surrounding the request:
- The request payload
- The user agent
- Outcome-based checks
The shortcoming is that an HTTP status code shows only that the endpoint responded. It does not reveal what the request contained or whether the request led to a successful compromise.
So if you’re investigating your own site, treat an HTTP 207 response as a reason to investigate, especially if the site was unpatched during the exposure window. However, it’s not evidence of compromise on its own, particularly if the site remained patched throughout the campaign.
What “Zero Compromised” Actually Means
Zero compromised means none of the 220 sites showed verified evidence of a successful WP2Shell compromise. It’s also the claim others are most likely to challenge, so it deserves the closest analysis.
Across all 220 sites, wp core verify-checksums reported zero modified core files. It indicates not one installation contained a core file that differed from the official WordPress release. And that’s the important single piece of evidence in this study because it measures an outcome rather than interpreting log data.
However, core file integrity was only one part of the investigation. We also examined two other categories that commonly indicate post-exploitation activity:
- New admin accounts
- PHP files sitting inside wp-content/uploads (a location that should never contain executable code)
The initial review flagged seven administrator accounts created after disclosure and 26 PHP files under uploads. On their own, both findings warranted further investigation.
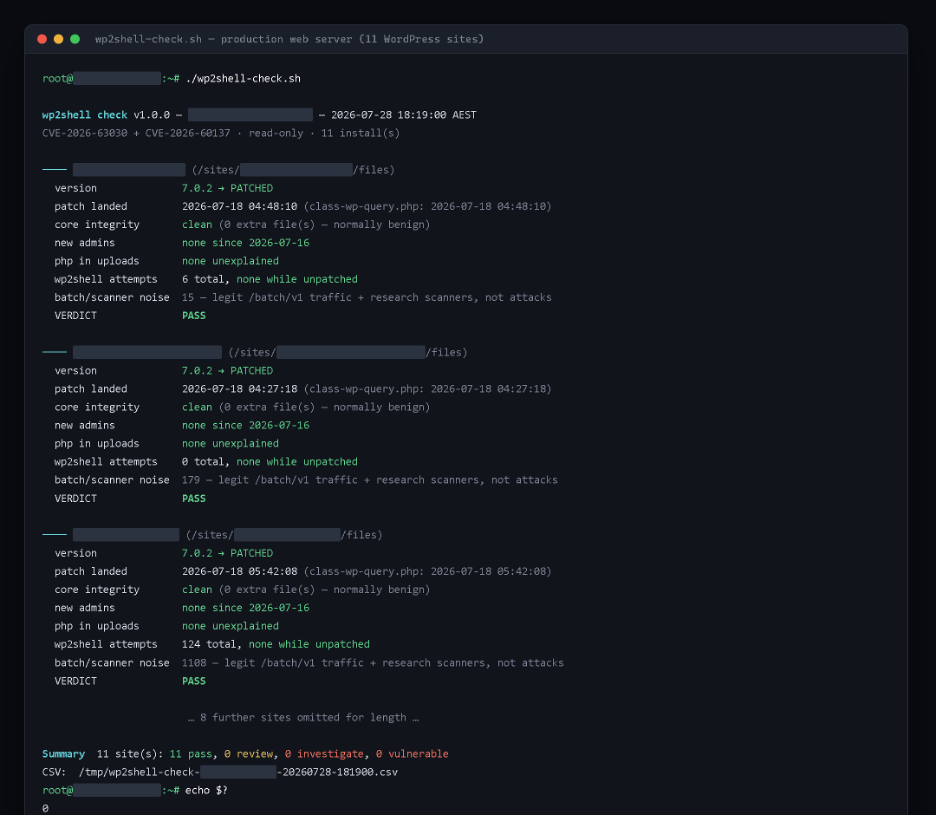
The tool below shows exactly how we flagged those indicators across the fleet before any manual review. And an INVESTIGATE verdict means a potential compromise indicator was present, not that a compromise was confirmed.
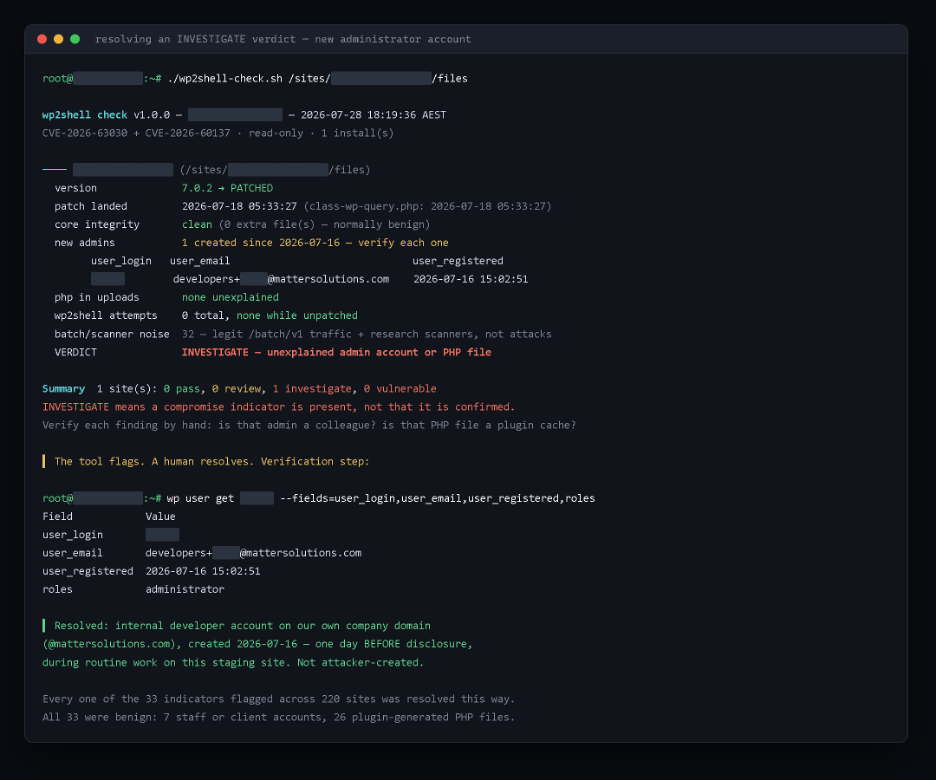
Manual investigation resolved each flagged indicator. One administrator account, for example, belonged to an internal developer and used the company’s own email domain. It had been created the day before disclosure during routine staging work, not by an attacker.
Our team repeated the same process for all 33 flagged indicators across the fleet, including all seven administrator accounts and all 26 PHP files under uploads. The administrator accounts belonged to internal staff or, in one case, a client’s own team member.
The PHP files told a similar story. We traced them to documented plugin behavior, including
- Breakdance and WPML Twig caches
- a Redux Framework extension
- Sucuri log files
- WPIDE backup files
All of which legitimately write PHP files to that directory.
Remember, zero compromised doesn’t mean nothing appeared suspicious. Instead, we investigated all suspicious indicators, and none proved to be evidence of an attacker.
One limitation is worth stating clearly. The SQL injection stage of the exploit chain can read database contents without modifying files on disk. Zero file-level compromise indicators therefore provide strong evidence against successful compromise, but they cannot prove that no data was read during the exposure window.
For that reason, the 11 sites that were attacked while still unpatched are undergoing precautionary credential rotation regardless of the file integrity results.
The Companion Tools
Everything in this piece came from two scripts, and we’re publishing both so you can run the same checks yourself.
- wp2shell-check.sh is the fleet checker. Once you point it at a single WordPress installation or a list of sites, it performs the version check, core checksum verification, administrator account audit, and log-based IOC filtering in a single pass. The script is read-only and makes no changes to the systems it examines.
- nginx-wp2shell-mitigation.conf is a temporary mitigation configuration for sites that cannot be patched immediately. It blocks known scanner user agents, rate-limits requests to the batch endpoint, and includes a commented-out emergency rule for situations where stronger temporary protection is necessary. As the configuration notes, these measures reduce exposure but do not replace installing the official WordPress security update.
We considered attaching both files directly to this post. But WordPress’s Media Library blocks script and config uploads by default, and we checked before assuming:
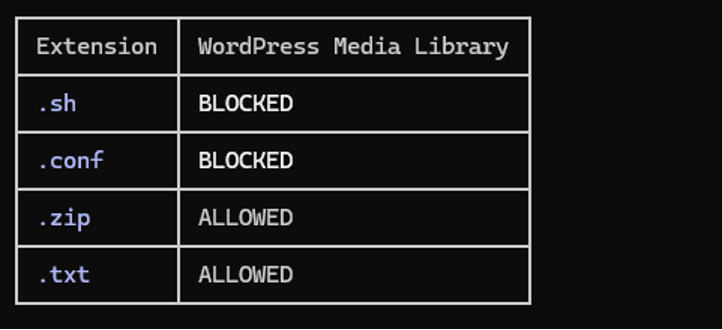
We could have expanded our upload whitelist to allow .sh files, but we chose not to. Why? Well, allowing shell script uploads on a WordPress security company’s own website, especially in an article about a WordPress remote code execution vulnerability. And it is the kind of configuration we would flag during a client security review.
Instead, both scripts are available in a GitHub repository alongside:
- The mitigation configuration,
- A README explaining the broad-versus-strict IOC methodology,
- The project license, and
- A redacted sample output CSV
GitHub Link: Click here
If the scripts don’t behave as expected in your environment, particularly around log path detection or the WP-CLI fallback, please open a GitHub issue instead of maintaining a local workaround. This way, reporting edge cases helps improve the tools for everyone running the same checks.
One Patch Down, More Coming
WordPress patched WP2Shell in its July 17, 2026 security release, but it won’t be the last WordPress core CVE that demands this level of attention.
Our analysis found no confirmed compromises across 220 WordPress sites, despite attackers targeting 11 of them before they were patched. Those results came from a repeatable process:
- Applying the security update quickly
- Separating genuine exploitation attempts from background traffic
- Verifying every suspicious indicator with the same repeatable process
You can follow the same process for upcoming…. vulnerabilities.
But for now, we’ve published the scripts we used throughout this analysis. So you can compare your results with ours, validate the findings against your own environment, and be ready before the next critical WordPress advisory arrives.